Text-to-Image
Architecture
Nano Banana
Infographic Architecture: Turning Data into Architectural Narratives
Prompt
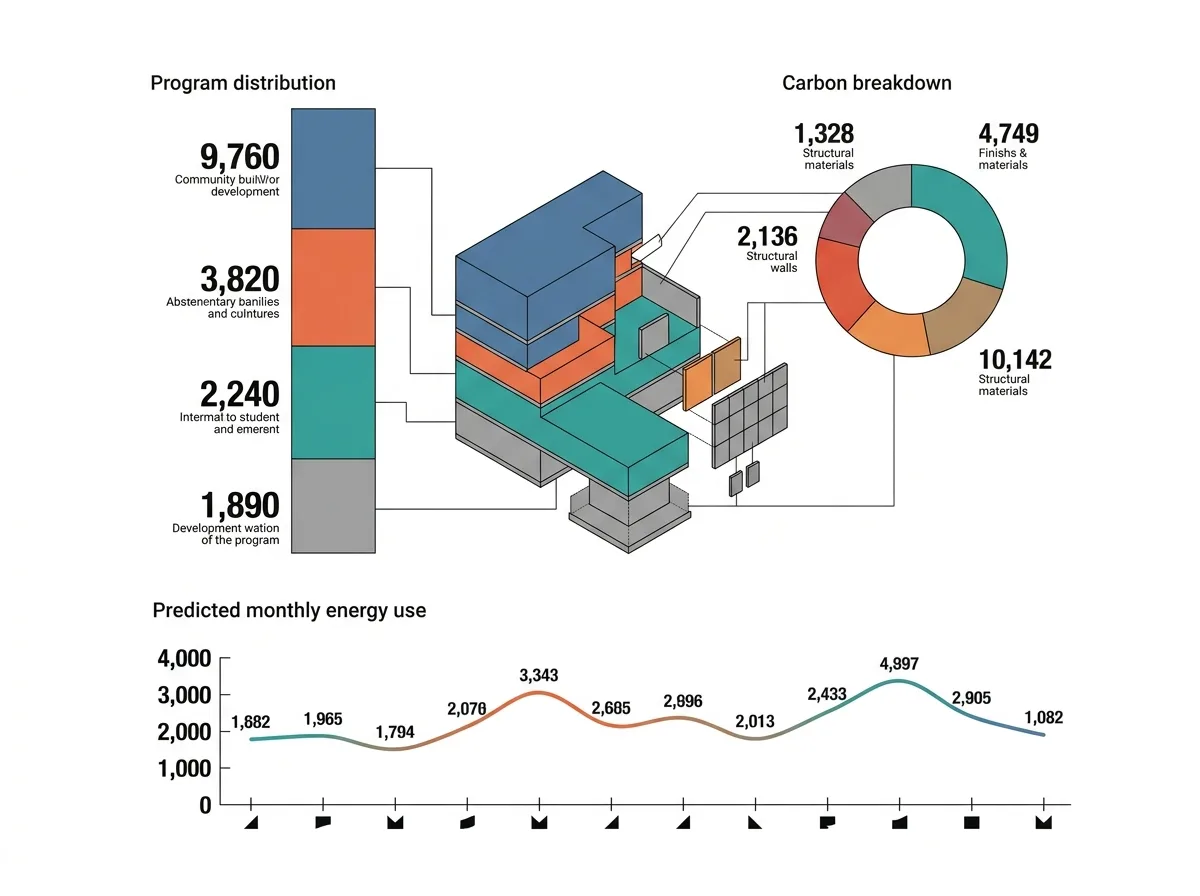
Create an architectural infographic that turns project data into a graphic narrative. Show a flat layout combining several chart types with the building itself as a graphic element: a stacked bar showing the area split by programme with each segment coloured and labelled; a donut chart of the material carbon breakdown; a simple line chart of predicted energy use across twelve months; and a small axonometric of the building beside them, its parts coloured to match the bar chart segments so the data and the form are visibly linked. Detail the numbers as large and prominent with small explanatory captions beneath. Show connecting hairlines drawing the eye from a chart segment to the corresponding part of the building. Keep the palette to four data colours plus grey, all flat with no gradient. Detail the typography as a clean sans-serif with a clear hierarchy between figure, label and note. Flat infographic layout, white background, no photorealism.